


Reshuffled
The new carrier mega-alliances started in the East-West container trades this month. Now that the game of musical chairs has stopped, for the time being at least, Drewry reviews the competing services in the big Asia-North Europe trade to see which carrier group has the edge.
Table 1
Alliance services in the Asia-North Europe trade, end-January 2015
Note: Does not include slot charter agreements; effective capacity is nominal capacity minus deductions for deadweight and high-cube limitations, out-of-scope and wayport cargoes.
Source: Drewry Maritime Research
Figure 1
Estimated share of effective weekly Asia-North Europe capacity, end-January 2015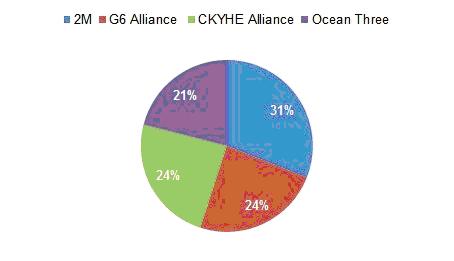
Source: Drewry Maritime Research
Later than some carriers had hoped, the new mega-alliances have now started operations in the main East-West container trades. By interrogating the forward schedules of the various partners, Drewry has taken a close look at how things stand now in the key Asia-North Europe trade and how things might develop by the end of the year. What stands out immediately is the fact that *every service is now controlled by one of the four alliances.
Maersk and MSC’s 2M is in the box seat, controlling 31% of the “effective” weekly capacity, following by the CKYHE and G6, both with 24%, and finally the Ocean Three on 21%. Our definition of effective capacity is nominal capacity (the average size of ships per service) minus deductions for deadweight and high-cube limitations and then again for out-of-scope cargoes, i.e. those relayed to areas outside the range. When relevant, operational capacities have also been adjusted for slots allocated to wayport cargoes, such as when a service also makes calls in say South Asia or the Mediterranean.
The total number of weekly Asia-North Europe services has been reduced from 22 to 21 compared with December 2014. The number of ships required to keep these services in a fixed-day weekly pattern has subsequently come down from 245 last month to 232 with smaller unwanted ships having been cascaded away from the trade. Despite these changes, the available capacity has largely been maintained with westbound slots of 218,500 teu per week, down just 1% on December. This has been achieved by the introduction of more new Ultra Large Container Vessels (ULCVs) – the average size of ship has increased from 12,400 teu to 12,600 – while the new schedules are more dedicated to North Europe with fewer wayport deductions.
Many feared that the formation of the mega-alliances would intensify the homogenisation of the industry whereby carriers can only compete with one another on price as they all have the same services. However, closer inspection of the schedules reveals that the alliances are far from uniform and between them they have created a pretty well-balanced network with wide port coverage at both ends of the trade.
Table 2
Weekly departures from Asia to North Europe by country, region, end-January 2015![reshuffled table2]](http://www.hellenicshippingnews.com/wp-content/uploads/2015/01/reshuffled-table2.jpg)
Source: Drewry Maritime Research
Inevitably, as befitting a country that is origin to around 70% of all the container traffic to North Europe, the main battle ground is China. Collectively, the alliances depart from 10 mainland China ports every week to North Europe, with a total of 74 weekly voyages. The 2M carriers have a clear advantage with 27 China to North Europe departures per week, well ahead of Ocean Three (18), CKYHE (17) and the lagging G6 (12).
The geographical spread of service calls naturally reflects the trade flows out of China as carriers essentially have to follow the cargo. Central China is the best served with a total of 37 weekly departures with Shanghai getting the most calls on 17, followed by Ningbo on 14 and Xiamen on 6. It is from this region that the 2M claims its dominance with 14 departures per week spread between the three ports, five more than its nearest rivals Ocean Three.
Ports in South China are also well served with 24 weekly departures, the majority from Yantian in the Shenzhen port complex, which has 16 loading calls. Again, 2M has the ascendancy with 9 weekly departures, compared with five each for the other alliances.
Perhaps surprisingly, North China ports are not better covered considering their rapid growth of late. Container traffic from the North has been outpacing the other Chinese regions as more manufacturing has moved there to take advantage of lower labour costs. Data from the Container Trades Statistics (CTS) shows that demand from North China to North Europe was up by 12% in the 11 months through November 2014, compared with 9% for the two other regions.
So far, the allure of North China is not reflected in the alliances’ schedules, where there are currently only 13 weekly departures to North Europe. Strikingly, the G6 carriers only make one North China-North Europe call (Qingdao on Loop 7) while the other three groups each make four calls. The region’s present coverage is commensurate with its volumes to North Europe, but carriers will need to find room for more North China calls in the future if they want to take advantage of the region’s potential.
While China as a whole can be said to have broad coverage, the same is not true for Japan and South Korea, which only have 7 and 9 weekly departures to North Europe, respectively. In Japan’s case, the paucity of direct services seems to be a fair a reflection of its declining volumes and contribution to the trade that saw no boost from the yen’s depreciation. CTS had Japan to North Europe box traffic down by 1% after 11 months last year. With around 6% of the total Asia departures to North Europe, but only 5% of the volumes, it seems unlikely that carriers will want to add more Japanese calls in a rush.
2M and G6 (with its two Japanese members MOL and NYK) are the go-to alliances for Northeast Asia to North Europe with 7 and 6 weekly departures. In stark contrast, the Ocean Three and CKYHE groups have zero Japanese calls, which is particularly odd for the latter considering the inclusion of Tokyo-based K Line.
While the outlook for more traffic from Japan/South Korea is weaker than other parts of Asia, the benefit of weaker competition does mean that incumbent carriers can charge a freight rate premium. Drewry’s Container Freight Rate Insight reports that 40ft spot rates ex Japan are currently around $1,000 above those from South China.
Table 3
Weekly arrivals in North Europe from Asia, by country, end-January 2015
Source: Drewry Maritime Research
At the other end of the trade, there are now 84 weekly arrivals in North Europe, spread between the obvious gateways with a handful of unique calls off the beaten track. Europe’s largest container port Rotterdam has the highest number of arrivals from Asia at 18, followed by Hamburg on 17. Between them the two major European ports receive 41% of all the calls from Asia, which considering the congestion issues they have both faced recently is possibly on the high side.
The UK has 19 calls in total split between Felixstowe (11) and Southampton (8), giving it a second-best 23% share of all calls into North Europe. The UK’s healthy coverage does dispel any lingering fears that the country would become a feeder-nation following the sale of Anglo-Dutch carrier P&O Nedlloyd in 2006.
All of the four alliances are well covered to the main markets of Germany, Netherland, UK, France and Belgium, but the 2M does offer a few specialist calls to Scandinavia (Aarhus and Gothenburg) and Poland (Gdansk).
Importers and exporters can have little complaint about the range of options available. For example, there are 14 weekly services from Shanghai to Rotterdam, the two busiest ports in the trade. That means shippers can call upon 16 carriers (not to mention non-alliance slot charterers) to get the most competitive freight rate quotes.
For the more time-sensitive shippers, the alliances also provide a wide array of transit times to suit their needs. Looking at Shanghai to Rotterdam again, transit times range from a quickest of 28 days to a slowest of 36 days.
Table 4 shows a selection of the fastest transit times available to the market on some of the busiest port-to-port lanes. With each alliance having a slight geographical bias, often dictated by members’ terminals interests, they all can boast some transit time supremacy somewhere, although the 2M partners have twice as many as the others from our selection of ports, giving them quite a substantial marketing lead.
Table 4
Fastest transit times for selected port pairs, Asia to North Europe, January 2015
Source: Drewry Maritime Research, derived from carriers’ pro-forma schedules.
Interestingly, the advent of the new alliances looks to have increased the average speeds of ships on the trade, which is probably a consequence of both dramatically lower bunker fuel costs and the desire of carriers to make their new services more attractive to customers. Drewry estimates that average westbound service speeds have sped up to 18.5 knots; versus 17.8kts as measured in December. The 2M again leads the way with an average speed of 19.8kts, while the G6 brings up the rear on 17.5kts.
This analysis was based on the pro-forma schedules as advertised on carriers’ website rather than operational schedules. Therefore, they are not guaranteed to reflect the reality, and as shippers will be well aware carriers do not have a great track record of delivering cargo on-time. Drewry’s Carrier Performance Insight reported that reliability in the Asia-Europe trade was only 64% in December.
Table 5
Estimated service speeds (knots), Asia-North Europe trade, end-January 2015
Note: Last Load Port to First Discharge Port, transit time derived from carriers’ pro-forma schedules as of January 2015
Source: Drewry Maritime Research
A couple of weeks ago we wrote about the huge orderbook and many of the biggest ships will have to be squeezed into the Asia-North Europe trade. Looking exclusively at the 13,000 teu+ newbuilds that are the most obvious candidates to enter the trade this year, a few things become apparent. Firstly, the G6 has no such ships on order and will undoubtedly lose ground by the end of the year. Ocean Three has the most of said ships and will subsequently leap-frog the G6.
The 2M lines, which are already on the fringes of the EU’s acceptable market -share threshold will also extend its market leading position, but not by so much to draw further scrutiny from regulators. The scheduled build completion dates of the 2015 ULCVs suggest that there will be as many as three new weekly services from the start of the second-half of the year, which will give shippers even more choice and likely suppress freight rates.
The G6 is definitely the alliance to watch. As this analysis reveals they have the weakest port coverage and transit times, while their shortfall of big ships will see them lose market share and lose ground on slot costs. Being in such an obviously weaker position risks them having to become price-takers in order to fill their assets. It is therefore unsurprising that the likes of MOL and OOCL have been heavily-linked with new orders for 20,000 teu ships. The six lines will hope they have not fallen too far behind by the time those ships are delivered.
Table 6
Scheduled deliveries of 13,000+ teu containerships in 2015
Note: Includes ships that have been delivered but have yet to be assigned to a service.
Source: Drewry Maritime Research
Figure 2
Potential share of effective weekly Asia-North Europe capacity, end-2015
Source: Drewry Maritime Research
This analysis has limited the alliance shares and coverage by examining own-tonnage services only, but individual carriers’ port-pair options can be widened further through slot-charter exchanges. This is already evident with carriers from the Ocean Three and CKYHE swapping space. More inter-alliance cooperation can be expected as lines try to fine-tune their networks.
Not being part of an alliance is not a barrier to market entry either, as Hamburg Süd has recently shown by joining the trade via slots on some Ocean Three services. As Drewry has previously asserted this type of cooperation among rivals can be win-win for both carriers and shippers. While the trade might look like a closed-shop from the outside, the reality is much more nuanced.
*The only exception is the New NEMO loop of CMA CGM and Hapag-Lloyd that contributes only a trace amount of capacity to the trade as ships arrive at Tilbury from Southeast Asia only after first discharging in South Asia and the Mediterranean.
Our View
The Asia-North Europe trade post-alliance restructure is generally well-balanced in terms of geographical coverage with strong competition in the key lanes. The broad range of options made available to shippers means that accusations that the industry is completely homogenised are unfair.
Source: Drewry Maritime Research (www.drewry.co.uk/ciw)
- For the first time, tianjin Port realized the whole process of dock operati...
- From January to August, piracy incidents in Asia increased by 38%!The situa...
- Quasi-conference TSA closes as role redundant in mega merger world
- Singapore says TPP, born again as CPTPP, is now headed for adoption
- Antwerp posts 5th record year with boxes up 4.3pc to 10 million TEU
- Savannah lifts record 4 million TEU in '17 as it deepens port
